
 5 Min Read

In every business, where data supremely reigns over informed decisions and confident strategy development to drive success, survey data analysis becomes a significant cornerstone.
Global leaders and business owners are excited and investing in gathering and understanding market trends, customer preference, employee satisfaction, and any key trends related to the business in the form of surveys.
Conducting various surveys is a smart move, but
- What about analyzing the data and converting the collected survey results into insightful survey reports?
- How to build such resourceful reports precisely for the decision-makers to get access to actionable insights?
- What are the best practices requiring meticulous attention for quality analysis?
Let’s get into these advanced steps of survey response analysis in this article.
What is Survey Data Analysis?
Survey data analysis refers to the systematic examination and interpretation of data collected from the surveys conducted. It involves transforming the raw survey results into quality statements and drawing insightful conclusions for actionable knowledge.
Survey data analysis empowers researchers to identify market trends, behavioral patterns, and responses to the questions considered during survey design for the generalization of results. This will enhance the improvement in business decisions, marketing plans, designing processes, and multiple critical areas in business processes.
Types of Survey Data in Survey Data Analysis
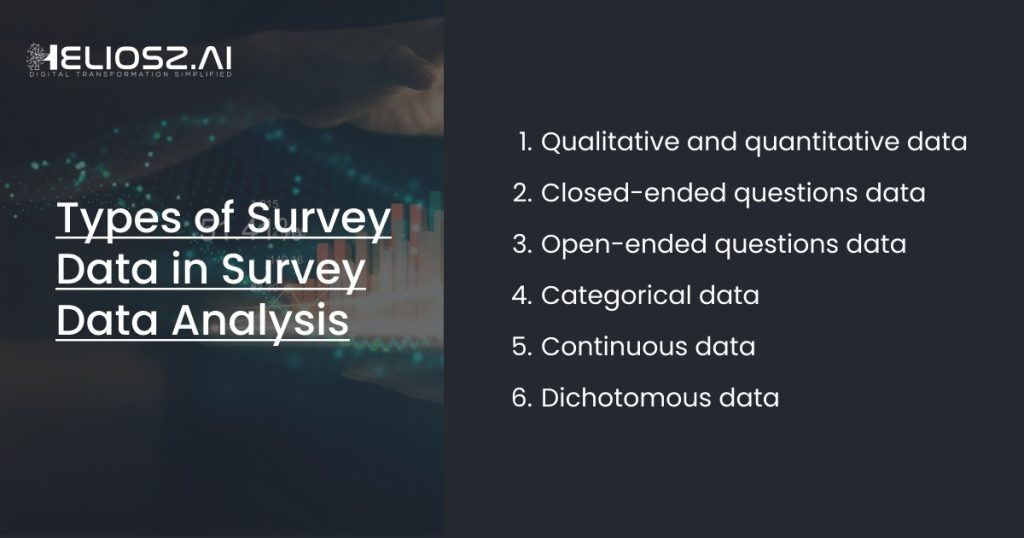
There are different types of survey data, and the distinctions are not limited to these headings. The data are categorized based on the nature of questions and formats of responses received.
While there are distinct categories for survey data types, the boundaries between them have become increasingly blurred, with overlapping features and factors. This fluidity means that survey data types are not rigidly fixed and may exhibit characteristics of multiple categories simultaneously.
Below are the key identified survey data types by primary investigation.
1. Qualitative and quantitative data
Quantitative data denotes numerical and quantitative survey results from mostly closed-ended questions. The data includes demographic details, satisfaction scores, ratings, and any numbers that are the outcomes of your survey questions.
Qualitative data means the textual or categorical responses which are not numerical. We get such data as responses to open-ended questions where the respondents will express and share their opinions, experiences, and information to the questions.
2. Closed-ended questions data in Survey Data Analysis
Closed-ended question data are collected from questions that are restricted to having predefined options. This will allow the respondents to select the options from a set of categories or answers in the form of dropdowns, multiple-choice, and rating scales.
Closed-ended data will provide structure that will facilitate the analysis and interpretation straight forward and deliver quantitative results.

3. Open-ended questions data (Natural language data)
Open-ended questions data are gathered from questions that do not have any predefined set of answers or options. The respondents are free to choose and share their responses such as opinions, thoughts, experiences, and preferences in a text field freely without any restriction.
Open-ended question data provides unstructured data which is intriguing to analyze and transform into presentable data. This will require sophisticated technologies and methods of survey analysis.
4. Categorical data
Categorical data comprises survey response data that fall into different categories or groups. Respondents will have the freedom to choose options from multiple categories.
This data is again categorized into nominal data and ordinal data. Nominal data consists of categories that do not have any inherent order and purely unordered descriptive responses. For example: Favorite car brands, colors, gender, ethnicity, etc.
In the meantime, ordinal data have hierarchical categories where the answers are recorded in natural order or ranks. For example: Income bracket, satisfaction level, ratings, etc.
5. Continuous data
Continuous data can be of any value in a certain range given for the survey question. This type of survey data is collected from questions that elicit numerical responses such as income, body weight, age, ratings, etc.
6. Dichotomous data in Survey Data Analysis
Dichotomous data consists of binary responses, where respondents choose between two possible options in survey questions. Similar to categorical data, dichotomous data is analyzed using methods appropriate for categorical variables.
Common examples include Yes/No, Agree/Disagree, and True/False responses. This type of data offers straightforward and effective survey results for decision-makers, providing insights into opinions, behaviors, attitudes, and biased suggestions.
Key steps to analyze your survey data in Survey Data Analysis
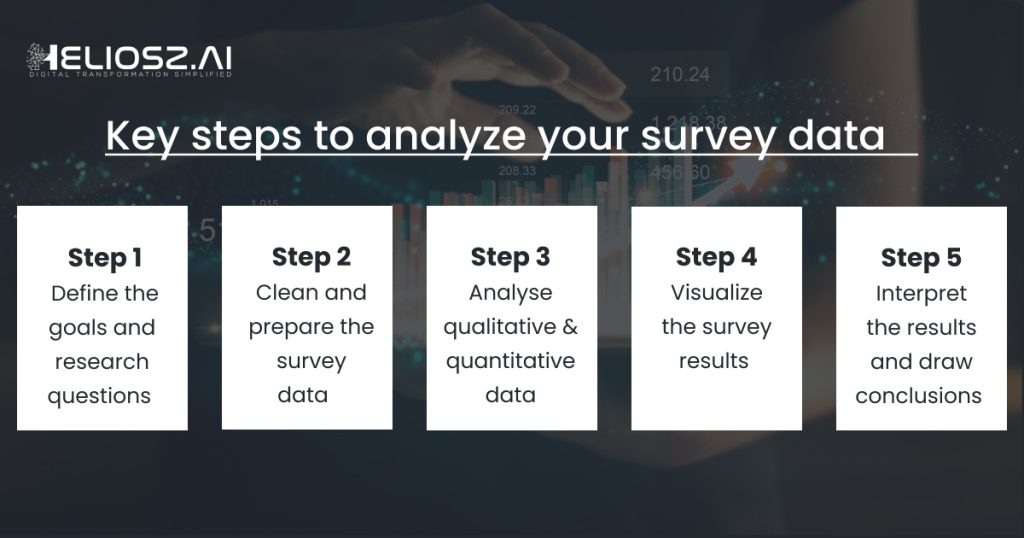
A systematic approach is required to figure out how to analyze survey data and turn the raw data into actionable insights. Here’s a breakdown of key steps involved in survey data analysis.
- Define the goals and research questions
- Clean and prepare the survey data
- Analyse qualitative and quantitative data
- Visualize the survey results
- Interpret the results and draw conclusions
Let’s discuss each step needs to conduct an effective survey data analysis for a clearer understanding in detail.
1. Define the goals and research questions
It is significant to clearly define the objectives and research questions before the survey data analysis. This primary step is to understand the information that you aim to extract from surveys and how to utilize that for positive outcomes.
The crystal-clear understanding of the survey will enable the analyst to determine relevant variables to consider and the various survey analysis software to leverage. This initial step is the absolute directional parameter to the entire survey analysis process and to the selection of appropriate analysis techniques.
2. Clean and prepare the survey data
Raw survey results come with a lot of inconsistencies, missing values, outliers, riddled with errors, and multiple confusions to analyze.
Cleaning and preparing the data is essential to ensure the reliability and precision of survey data analysis. This step of survey analysis includes various practices such as data validation, removing duplicates, standardizing variables, addressing missing data through imputation or deletion, and data corrections.
In this stage, the analyst will verify data by measuring the accuracy and scrutinizing typos to decide whether the result is usable and considerable for further analysis.
3. Analyse qualitative and quantitative data
A survey will have a mix of questions and data that are both quantitative and qualitative. Qualitative data includes textual responses and quantitative data includes numerical responses.
Understanding and cross-tabulating these data using statistical analysis, thematic analysis, sentimental analysis, and other relevant analytical methods will further streamline the whole survey data analysis to perfection.
4. Visualize the survey results
Visual representation of survey results will lead to comprehension and enhancement of effective communication with decision-makers.
The survey data can be represented in multiple ways like bar charts, pie charts, frequency tables, histograms, scatter plots, heatmaps, infographic charts, line graphs, etc.
This step is significant to facilitate the effortless identification of trends and patterns observed in surveys for deeper analyses.
5. Interpret the results and draw conclusions
The final step in survey data analysis includes synthesizing the findings from surveys to draw meaningful conclusions.
This entails critically analyzing the patterns, trends, and relationships revealed through the analysis and considering their implications for the research questions and broader objectives.
It’s essential to assess the significance of the findings, identify any limitations or biases in the data analysis, and consider alternative explanations for the observed patterns. It will be the final step that provides actionable recommendations or implications based on the findings. A clear and concise interpretation of results is vital for informing decision-making and driving actionable insights from the survey data analysis.
How to present survey results?
Presenting survey results effectively requires careful planning and execution to ensure that the findings are communicated, accurately, and comprehensively.
Below is a detailed guide on the different ways to present survey results professionally and technically to the stakeholders.
Charts and graphs
- Charts and graphs are fundamental tools for visualizing survey data.
- Bar charts are effective for comparing categories or groups.
- Line graphs are suitable for showing trends over time.
- Pie charts can display the proportions of a whole.
- Scatter plots reveal relationships between variables.
- Use appropriate labeling, titles, and legends for clarity.
- Ensure consistency in style and color schemes across all charts.
Videos and animations
- Videos and animations offer dynamic ways to present survey results.
- Create engaging visual narratives to communicate key findings.
- Use motion graphics to illustrate complex data patterns or processes.
- Incorporate real-life testimonials or interviews to add depth.
- Keep videos concise and focused to maintain viewer engagement.
- Utilize professional editing techniques for a polished final product.
Infographics
- Infographics condense survey data into visually appealing designs.
- Arrange information hierarchically for easy comprehension.
- Use icons, illustrations, and charts to represent data points.
- Incorporate text sparingly, focusing on key insights or conclusions.
- Maintain a cohesive design theme to enhance visual coherence.
- Ensure that the infographic is easily shareable across various platforms.
Presentations
- Presentations provide a structured format for delivering survey results.
- Use slides to organize information logically, starting with an overview and proceeding to detailed findings.
- Incorporate visuals such as charts, graphs, and images to complement textual content.
- Limit text on slides to key points, using bullet points for clarity.
- Practice delivery to ensure smooth transitions and effective communication.
- Encourage audience interaction through Q&A sessions or polls.
Tables and spreadsheets
- Tables and spreadsheets offer a detailed breakdown of survey data.
- Organize data into rows and columns for easy comparison.
- Use formatting features such as color-coding and conditional formatting to highlight important information.
- Include summary statistics such as means, medians, and standard deviations where relevant.
- Provide clear headings and labels for each column and row.
- Consider including a separate summary table to highlight key takeaways.
Benchmarking your survey data in Survey Data Analysis
Benchmarking survey data involves establishing a standard reference point and utilizing collected data to gauge future trends and performance.
When conducting a survey for the first time and gathering responses, this initial dataset can serve as the benchmark for subsequent analyses. For instance, if you’ve gathered data on customer satisfaction regarding a particular service, you can periodically repeat the same survey to track changes in satisfaction levels over time.
Using the initial survey data as a benchmark allows for a comparative analysis of future survey results. By examining changes in customer satisfaction levels relative to the benchmark data, you gain insights into evolving trends and patterns.
For example, if satisfaction levels increase or decrease compared to the initial survey, you can investigate the underlying reasons behind these shifts.
This enables a deeper understanding of customer preferences, behaviors, and perceptions. Moreover, benchmarking facilitates the identification of areas for improvement and the evaluation of the effectiveness of implemented strategies.
By analyzing future survey results based on the benchmarked data, you can assess the impact of initiatives aimed at enhancing customer satisfaction or addressing specific issues identified in earlier surveys.
Regularly benchmarking survey data provides a systematic approach to monitoring and evaluating changes in customer preferences and perceptions over time. It enables businesses to stay responsive to evolving market dynamics and make data-driven decisions. How to present survey results.
Common mistakes in Survey Data Analysis and tips from the team at Heliosz to avoid them
Survey data analysis is a powerful resource for data-driven decisions for every business. However, flawed analysis can hinder effective strategy development.
Here, we study the common mistakes encountered during survey data analysis, along with strategies that are recommended by the expert team at Helosz to prevent them.
1. Biased approach to sampling pool
Mistake:
One of the most critical steps in survey research is selecting a representative sample. However, bias can be introduced if the sampling pool does not accurately reflect the population of interest. This can occur through various means, such as convenience sampling, where respondents are easily accessible but may not represent the broader population, or through self-selection bias, where individuals choose whether to participate in the survey, leading to a non-random sample.
Solutions:
- Utilize random sampling techniques whenever possible to ensure that every member of the population has an equal chance of being selected.
- Additionally, consider stratified sampling to ensure representation across different subgroups within the population.
- Finally, be mindful of biases that may arise from the survey administration method and take steps to mitigate them.
2. Mistake in identifying non-response bias
Mistake
Non-response bias occurs when certain groups within the sample are less likely to respond to the survey, leading to an inaccurate representation of the population. Failure to address non-response bias can distort the survey results and compromise the validity of the analysis.
Solutions
- Monitor response rates throughout the survey administration process and compare the characteristics of respondents and non-respondents.
- Implement techniques such as weighting or imputation to adjust for non-response bias and ensure that the sample remains representative of the population.
- Additionally, consider follow-up efforts to encourage participation among underrepresented groups.
3. Ignoring data cleaning
Mistake
Survey data often contain errors, inconsistencies, and missing values that can distort analysis results if left unaddressed. Ignoring data cleaning processes can lead to erroneous conclusions and undermine the reliability of the findings.
Solutions
- Prioritize data cleaning as a fundamental step in the survey data analysis pipeline.
- Develop robust protocols for identifying and addressing errors, such as outliers, duplicates, and missing values.
- Utilize data validation techniques and automated algorithms to flag potential anomalies and discrepancies.
Conclusion
Survey data analysis serves as a powerful and thorough research methodology for comprehending the preferences, behavioral tendencies, evolving interests, and invaluable opinions of target audiences.
By employing meticulous analytical techniques and crafting comprehensive survey reports presented concisely, stakeholders can gain pragmatic insights that are easily digestible and actionable.
Why choose Heliosz.ai for efficient Survey Data Analysis?
If you find yourself among the ranks of decision-makers grappling with a mountain of spreadsheets, where data sits in its rawest form, and deriving meaningful conclusions feels like solving a maze, then Heliosz.ai is the solution you need.
With Heliosz.ai, your data undergoes meticulous analysis, transforming it into actionable insights that drive business growth.
By harnessing the transformative power of analytics, Heliosz.ai empowers you to reap the full potential of your data, ultimately boosting the return on investment (ROI) across all your business activities.
Say goodbye to the complexities of data analysis and hello to a clearer path toward informed decision-making and strategic success.