Email:
inquiry@heliosz.ai
 Phone: +1 (332) 255-6223


 5 Min Read
CPG brands pour money into trade promotions, retail media and digital ads. Ask most of them which part of that spend moved product, though, and the answer gets vague.
Trade alone eats roughly a fifth of revenue at a typical consumer goods company. Worse, McKinsey, drawing on Nielsen data, found that more than half of all promotions lose money. CPG marketing analytics exists to close that gap.
Below, we walk through what it is, where it pays off, the traps that slow brands down, the metrics worth tracking, and how to get a first project running in 90 days.
What Is CPG Marketing Analytics?
Put simply, CPG marketing analytics uses sales, shopper, promotion and media data to understand how marketing and trade spend affect revenue and profit.
That means connecting three datasets that rarely sit in the same department: what you spent, what sold, and who bought it. Connecting these datasets creates the foundation for measuring performance. Models and experiments then help estimate how trade, media and pricing influence sales and profit.
Benefits of CPG Analytics in Marketing
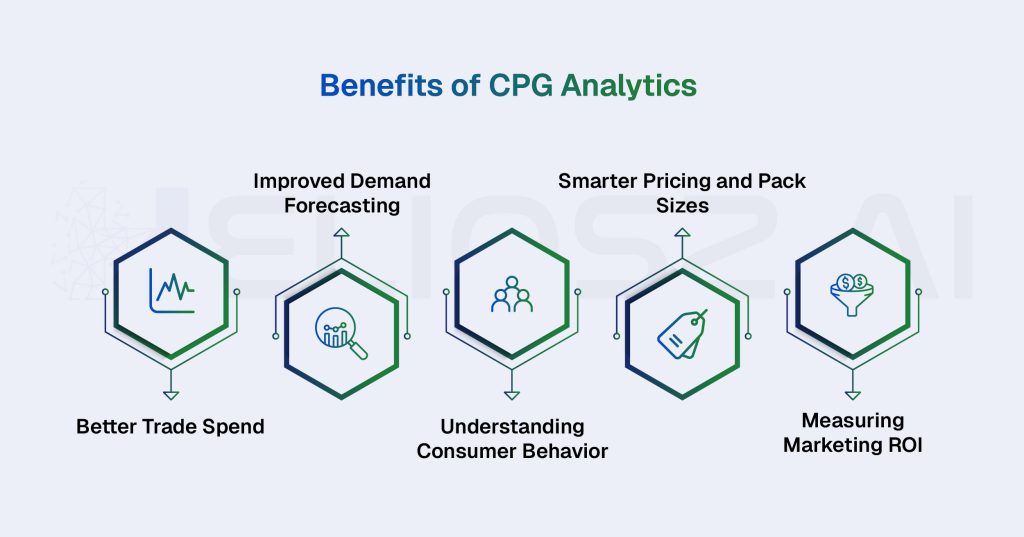
Every benefit below traces back to the same root: money moves toward the activities that earn it.
Smarter Trade Spend Decisions
Trade is usually the largest line on a brand’s P&L after cost of goods. It is also the one finance trusts least.
Good analytics lets you hold each promotion up against four questions:
- Would we have sold this much anyway?
- Where did the extra buyers come from: a rival, the wider category, or our own range?
- How much demand did it borrow from the weeks that followed?
- Once the deal was paid for, was any profit left?
Answer those honestly and budget can shift from losing events to winning ones. No blanket cuts required.
More Accurate Demand Forecasting
Promotions play havoc with supply plans. A deep discount might double sales for a fortnight. Afterwards, volume sags while households work through the extra packs, and retailers sit on cases they forward-bought at the deal price.
Feed the promo calendar and past lift-and-dip patterns into the forecast, and two things improve. Shelves stay stocked during the event, and less stock is stranded when it ends. Retailers notice both.
Deeper Consumer Understanding
Who buys you, and do they come back? Retailers now hand brands much of that answer. Walmart’s insights platform, renamed from Luminate to Scintilla in 2025, counts Red Bull, Procter & Gamble and Kimberly-Clark among its users. Kroger offers something similar through 84.51° Stratum.
The questions worth asking of that data are plain ones. Are we winning new buyers? Did they come from a competitor or from another of our own products? Most telling of all, are they buying again? Repeat purchase is often the first sign of whether a product has a future.
Evidence-Based Pricing and Pack Decisions
Pricing debates tend to run on instinct. Analytics swaps that for elasticity curves, pack-switching patterns, and a clear view of where price can rise without volume falling away.
Unilever offers a good example. Before changing price and pack sizes on Unox and Andrélon, two of its Dutch brands at the time, it ran virtual shelf studies with SKIM to predict the impact on volume and revenue. Its teams then walked into retailer negotiations with elasticity data in hand, not opinions.
Clearer Proof of Marketing ROI
Marketing still struggles to convince finance. In a 2025 survey by Perion and Advertiser Perceptions, only 22% of senior marketers strongly agreed they had the data to justify their value to the CFO.
Measure trade, media and pricing against the same sales numbers and that conversation shifts. The question stops being whether marketing works. It becomes where the next dollar should go.
Common Challenges in CPG Data Analytics
The math is rarely what holds a brand back. Clean data is harder, and getting people to act on the results is harder still. Four obstacles show up almost everywhere.
Fragmented Data
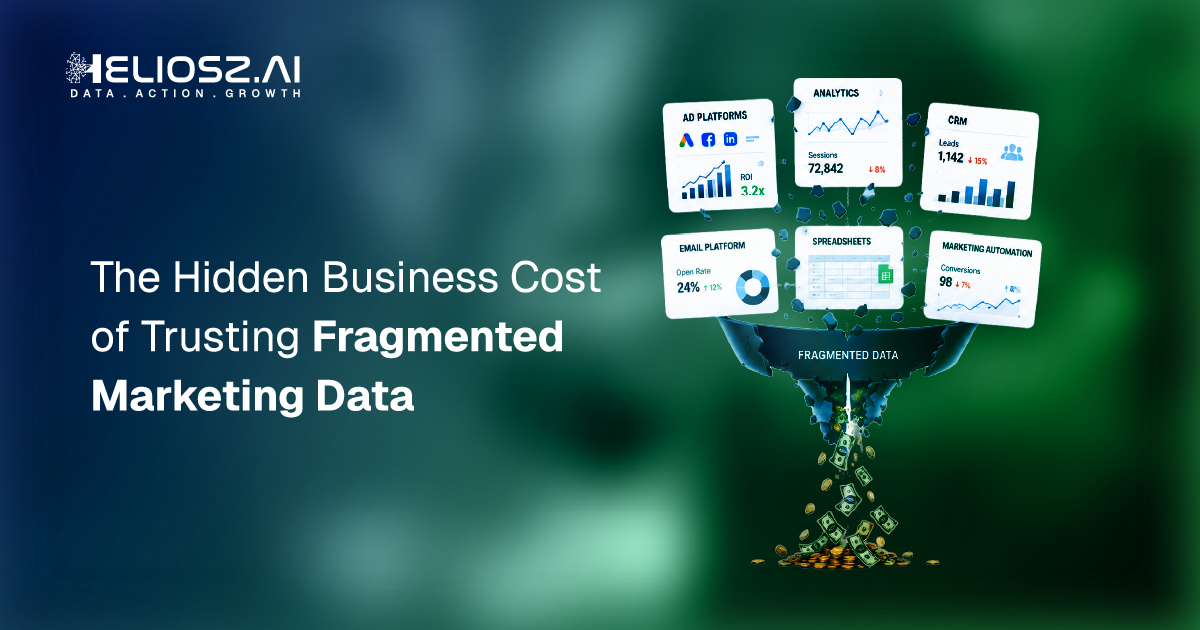
The promo calendar lives with sales. Media reports sit in marketing. Finance holds the true cost of trade, and the e-commerce team runs Amazon on its own.
Taken one at a time, each team’s figures make sense. Side by side, they almost never reconcile, and meetings turn into arguments about whose number is right. Centralizing the data is a start. Giving one person ownership of the combined view, definitions included, matters more.
Limited Retailer Access and Reporting Lag
Much of your most valuable sales data belongs to the retailer, who decides what you see, how often and at what price. Walmart is typical: basic sales and inventory reporting is free to every supplier, while shopper behavior data sits behind a paid tier.
Timing is the other headache. A few portals refresh daily. Syndicated data from NIQ or Circana usually lands weekly, and with a lag. Trade deductions can take months to settle. So by the time a brand learns a promotion lost money, the next one is often already booked.
Perfect coverage isn’t realistic. Buy depth where most of your revenue sits and work with estimates elsewhere.
Messy Product Data
It sounds trivial. It isn’t.
The same 12-pack might appear as “12CT” at one retailer, “12 PK” at a second and a bare item number at a third. Unless someone maps them together, every share, sales and promotion figure is slightly off, and no dashboard will warn you.
The cure is unglamorous: one master product list built on GTIN/UPC codes, each retailer’s item codes mapped to it, and an owner who keeps it current. AI shopping is raising the stakes. In 2026, NIQ warned that products without structured, machine-readable data risk becoming invisible to AI assistants.
Insight That Never Becomes Action
Good analysis is common. Acting on it is not.
A Market Logic Software survey found that a large share of key marketing and product decisions are still made without consumer insight. The reasons are familiar. The analysis arrives after plans are locked, or never leaves a slide deck, or sales incentives reward volume, so a money-losing promotion still looks like a win.
Changing how people work tends to fix this faster than new software. In one McKinsey case, a European manufacturer handed its key account managers a promotion simulator they could run themselves. They began building promo plans from scratch rather than copying last year’s calendar. Because the insights were theirs to use, trust in the analysis grew.
CPG Analytics Use Cases
Nobody needs to tackle all of these at once. They’re listed roughly in the order brands tend to see returns, and most begin with the first.
Trade Promotion Optimization
The goal here is simple: find the promotions that earn money, run more of them, and retire the rest.
Take the European manufacturer from the McKinsey case above. By combining syndicated sales with anonymized retailer loyalty-card data, it learned that its deals were missing price-sensitive shoppers, who favored smaller entry packs. So it moved more promotions onto small formats. It also found that some non-price mechanics recruited new buyers better than discounts did. Within a year, EBITDA was up 4–5%.
Notice where that gain came from. Promotion analytics usually pays for itself by trimming waste and improving the mix, not by chasing volume.
Retail Execution and Shelf Performance
No promotion survives an empty shelf. That’s why CPG retail marketing now extends to what shoppers see in the store.
With image recognition, a field rep photographs a shelf and gets gaps, misplaced products and missing displays flagged on the spot. GoGo SqueeZ used Trax this way and reported wider distribution along with stronger sales.
Speed is the real prize. Shelf problems can take weeks to surface in sales reports, and by then the lost sales are gone for good.
Pricing and Pack Architecture
Sometimes the smartest price increase is a smaller pack.
Coca-Cola’s mini cans show how. Ounce for ounce, they cost far more than a standard can, yet shoppers liked the portion size. Coke’s leadership went on to credit smaller packages with much of its 2015 revenue growth.
Your own range probably hides similar openings. Look for the sizes shoppers trade between, the price points they notice, and the gaps where a new pack would win fresh buyers rather than cannibalize an existing one.
Media Mix and Attribution
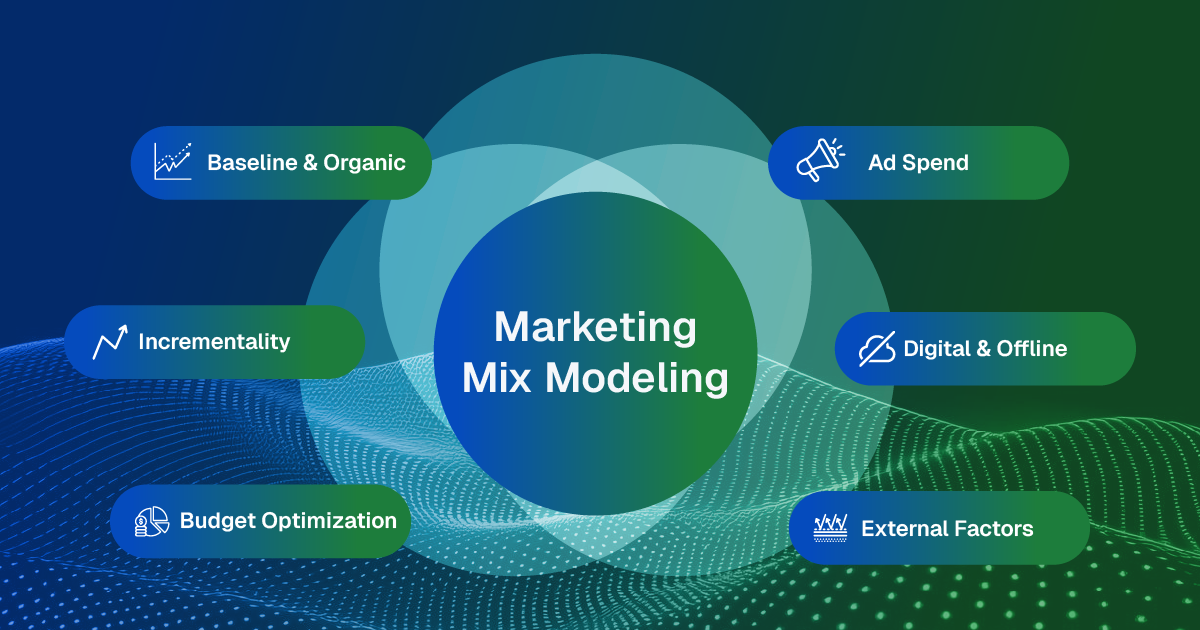
Which channels drive sales, and when does extra spend stop paying? A marketing mix model (MMM) answers both.
Estée Lauder’s Taiwan team built one with Google’s open-source Meridian, working alongside the agency fifty-five. Several channels turned out to be saturated. Budget moved to those still growing, and revenue rose even as media spend fell.
MMM is also a fairer way to judge retail media, since every channel is held against the same sales data rather than its own platform’s report. Calibrate the model with real experiments, such as geo holdout tests, so its estimates stay anchored to measured lift.
New Product Launch Tracking
Plenty of launches look strong for a month and then fade. Repeat purchase reveals the direction long before total sales do.
Catalina’s research makes the point starkly: of shoppers who tried a new food or beverage item in its first six months, only 11% were still buying it a year later. Trial can look healthy while a launch is quietly failing. Track repeat rates weekly and you leave yourself time to fix the problem, or to stop funding it.
Media measurement belongs in the launch plan as well. When Reckitt brought Nurofen Caps to Italy, Circana compared regions that saw its YouTube campaign with regions that didn’t. Pharmacy sales were clearly higher where the ads ran, which gave the team the evidence to keep spending.
Shopper Segmentation
A loyal buyer and a deal hunter shouldn’t get the same discount.
Segmentation sorts shoppers by how they really buy: loyalists, occasional buyers, bargain seekers and newcomers to the category. Discounting the loyal group mostly gives away margin on sales you’d have made anyway.
McKinsey describes a North American CPG company that discovered many of its promotions were subsidizing existing loyalists. Deals on smaller packs, in regions where it wasn’t the market leader, worked better. They reached shoppers with no brand loyalty, drew infrequent buyers into the category, and earned enough extra sales to justify the cost.
CPG Marketing Metrics That Matter
A short list beats a long one, especially when finance has signed off on every definition before the first dashboard goes live. These seven cover most decisions a brand team faces.
| Metric | What it tells you | How to measure it |
| Baseline sales | What you’d sell with no promotion running | Modeled from non-promoted weeks, adjusted for season, distribution and price |
| Net incremental volume | The extra volume an activity truly caused | Sales above baseline, minus the post-promo dip and cannibalization |
| Promotion ROI | Whether a deal made money | Incremental gross profit minus event cost, divided by event cost |
| Price elasticity | How volume reacts to a price change | % change in volume ÷ % change in price |
| Incremental ROAS | Revenue a media channel genuinely added | Incremental revenue ÷ spend, from MMM or lift tests |
| Repeat rate | Whether triers come back | Repeat buyers ÷ triers, tracked weekly after launch |
| Distribution and on-shelf availability | Whether shoppers can find you | Weighted distribution (% ACV) and share of store visits with stock on shelf |
Two habits keep these honest. Judge promotions on profit, never on volume. And report net lift rather than the raw spike, because a deal that borrows next month’s sales hasn’t grown anything.
CPG Analytics Tools and Software: What to Look For
Few brands are short of software. What they lack is software that agrees with itself.
Vendor pitches in this space blur together, so sort the options by the job each one does:
| Layer | What it does | Examples |
| Retail data integration | Pulls POS, inventory and supply data from retailer portals and distributors, then cleans and standardizes it | Crisp, SPS Commerce |
| Syndicated and retailer data | Category-wide sales, share and shopper data | NIQ, Circana, Walmart Scintilla, 84.51° Stratum |
| Trade promotion management and optimization (TPM/TPO) | Plans promotions, tracks spend and deductions, models lift and ROI | SAP, Vividly, UpClear BluePlanner, Visualfabriq |
| Marketing measurement | Marketing mix modeling and incrementality testing across channels | Haus, Recast, Google Meridian (open source), NIQ |
| Data warehouse and BI | Stores the joined data and serves dashboards | Snowflake, Databricks, Power BI, Tableau |
Closing Thoughts
Strip away the tools and the jargon, and CPG marketing analytics comes down to connecting trade, media and pricing spend to sales and profit. The goal is to use reliable data and metrics to make better budget decisions before the next promotion calendar is locked.
Much of the waste in a CPG budget may already be visible in the data a brand owns. The challenge is identifying it early enough to change a decision.
Optivos helps CPG brands bring retailer, trade and media data into a single view, showing which promotions and campaigns deliver returns and where spending needs to be reconsidered.
Want to see what this could mean for your portfolio?