
 5 Min Read

Imagine you’re a fisherman who knows, before the net hits the water, whether this cast is worth making.
Not exactly. But close enough to stop guessing.
What would you do?
You’d choose the right waters, cast with precision, and stop when the return drops.
Revenue forecasting in marketing analytics should just do that for your marketing team. Not predict the future perfectly, but give you enough visibility to decide before you spend. Which channels to fund. How much to invest. What return to expect.
Revenue Forecasting in Marketing Analytics: The Real Problem Isn’t Data
You have more dashboards than any CMO a decade ago could have dreamed of. Exclusive spend data, multi-touch attribution, channel-level ROAS, customer lifetime value models, etc.
And yet, when the CFO asks what last quarter’s campaign spend actually returned, the room goes quiet. This is where revenue forecasting in marketing analytics fails.
Every dollar you can’t trace is a dollar you can’t defend; and a budget cut waiting to happen.
Attribution breaks down the moment you’re running more than three channels. Every platform reports its own numbers, and they never add up.
And that silence in the boardroom? That’s not a data problem. That’s a credibility problem.
QUICK READ: Marketing Budget Optimization Guide
Marketing Revenue Forecasting: How Forecasting Revenue from Marketing Spend Has Worked So Far
The process isn’t the mystery.
- Pull historical spend and revenue data
- Pick a time window
- Account for seasonality and internal variables
- Choose a modeling method, like a spreadsheet
- Monitor variances as the quarter unfolds.
Most marketing teams have done some version of this. The problem isn’t the process. It’s what the process was never built to handle; scale, channel complexity, and a CFO who wants a number they can stake a decision on.

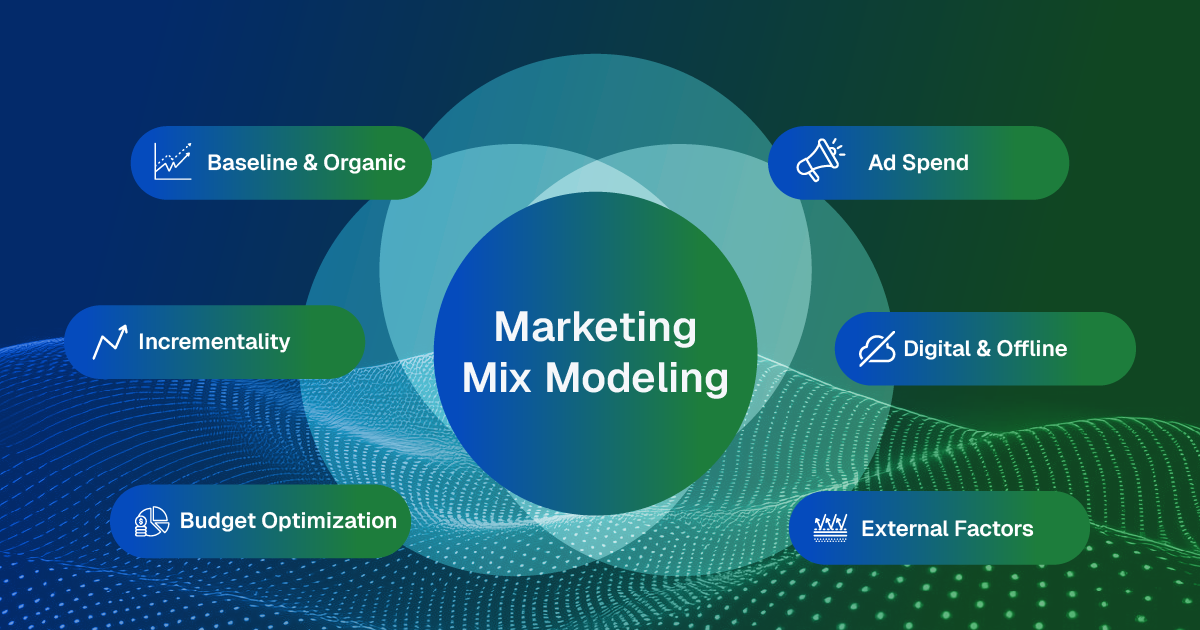
Revenue Forecasting Models
A revenue forecast is the document that should shape every major marketing decision before the year begins. Which channels get budget. Where you push for growth and where you protect margin. How aggressively you acquire versus retain. Whether your team is sized for the number you’re being asked to hit.
Building a forecast model means understanding where revenue comes from (by channel, by segment, by motion) and what it costs to move each lever. It means accounting for saturation, lag, and seasonality before committing spend.
When your Cost Per Acquisition starts climbing as you scale, the last thing you need is a model you can’t explain to your CFO. You need a system — one built on skill, structure, and method. One that reverse-engineers every dollar of spend back to the number you already promised leadership.
Done right, it surfaces your biggest risks before they become budget conversation.
Importance of Marketing Analytics Revenue Prediction: What a Revenue Forecast Actually Needs to Do
A revenue forecast has three jobs.
- Justify spend before it happens.
- Course-correct mid-flight, flag early enough that you can reallocate.
- Third, defend the number in the boardroom.
Most forecasting models are built for one of these. Teams that only forecast at planning season can justify spend but can’t course-correct. Teams living in dashboards can react but can’t defend.
The best models do all three. Most teams don’t have one.
QUICK READ: Hidden Cost of Fragmented Marketing Data
The Model That Works at Scale
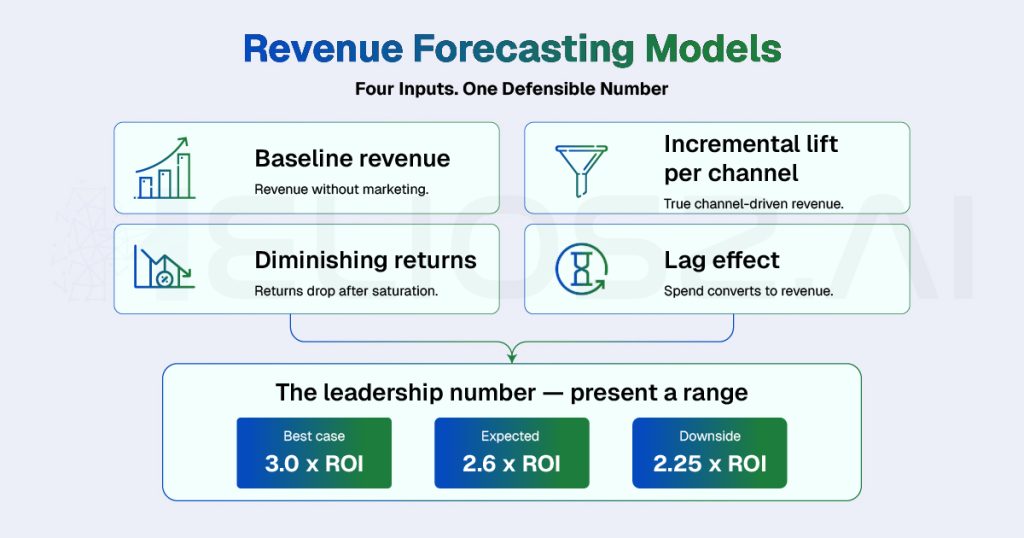
Baseline revenue is what your business generates with zero marketing; organic search, word of mouth, repeat customers. Know this number. Everything above it is what marketing is actually responsible for.
Incremental lift per channel is the real contribution of each channel to revenue; not what Google Analytics says, not what Meta reports. Last-click and first-click attribution both fail to reflect true contribution at scale. You need incrementality testing or media mix modeling to get to a number you can actually defend.
Diminishing returns curve tells you where spend stops compounding (every additional dollar gives you a slower gain in output). Every channel has a saturation point. The forecast that ignores this will always overpromise at higher budgets.
Lag effect is when spend actually converts to revenue. Paid search might be days. Brand campaigns might be quarters. Collapsing these into the same window is where most forecasts quietly break.
Most teams forecast from last month’s performance, not from the curve. That works until you scale.
The Leadership Number
When you walk into a boardroom with a revenue forecast, the CFO isn’t looking for a number. They’re looking for a reason to trust the number.
That means showing your assumptions, not hiding them:
- What’s the baseline?
- What’s the incremental lift you’re betting on, and which channels is it coming from?
- What is your blended ROI on the next dollar of spend?
- What happens to the forecast if CAC climbs 15%?
Example: (what a CFO actually wants to see):
You’re asking for an extra $20M in budget.
Base case: generates $60M incremental revenue → 3x blended ROI
Now apply pressure:
- If CAC rises 15% → revenue drops to $52M → 2.6x ROI
- If conversion softens → revenue drops to $45M → 2.25x ROI
Now you’ve shown:
- Best case
- Expected case
- Downside case
Present a range, not a single figure. No overconfidence. CFOs have seen enough “perfect” forecasts miss to know better.
Connecting Marketing Spend to Revenue: Forecast and Increase Revenue with Heliosz.ai’s Help
The gap between marketing spend and revenue is your margin. Closing the gap requires more than better dashboards; it requires the right models, the right architecture, and AI built for commercial outcomes.
That’s what Heliosz.ai does for marketing teams. Our Marketing Effectiveness Measurement accelerator connects spend to revenue; with AI-powered budget simulations, incrementality modeling, and actionable insights that hold up in a boardroom, not just a marketing report.
The Active Campaigns section shows every channel, its spend, the revenue it’s generating, and whether that number is moving up or down; all in one place, without toggling between five different platform reports.
It also powers conversational analytics through “Talk to My Data,” enabling teams to query complex datasets in plain English. Ask it something like:
“Which channels are approaching diminishing returns, and where should we reallocate budget before the next planning cycle?”
Whether you’re running media mix modeling for the first time or rebuilding a forecast that leadership no longer trusts, Heliosz.ai brings the data engineering, data science, and commercial AI expertise to close the loop; from channel spend to the revenue number you committed to.
You already know what you need the forecast to do. Heliosz.ai helps you build one that actually does it.
The net hits the water. You already know.
FAQs
What is revenue forecasting in marketing analytics?
It’s the process of estimating how much revenue your marketing spend will generate (by channel, by segment, by motion) before you commit the budget.
How do you connect marketing spend to revenue outcomes?
Build incrementality testing or media mix modeling into your process. Every channel needs a clean lift number; not last-click, not first-click. That lift, mapped against your baseline revenue, is the link.
What is the difference between revenue forecasting and sales forecasting?
Sales forecasting starts from the pipeline (deals in progress, conversion rates, rep capacity). Revenue forecasting in marketing starts upstream (from spend, channel performance, and incremental lift).
How does revenue forecasting affect business decisions?
It determines where budget goes, how aggressively you acquire versus retain, whether your team is sized correctly, and what number you walk into the boardroom with.
What are some common mistakes to avoid in revenue forecasting?
Forecasting from last month’s performance instead of the diminishing returns curve. Collapsing lag effects across channels into the same window. Relying on blended CAC instead of channel-level CAC. Presenting a single number to the CFO instead of a stress-tested range.