Email:
inquiry@heliosz.ai
 Phone: +1 (332) 255-6223





 5 Min Read
Ask five channel teams how a campaign performed and you’ll usually get five good answers. YouTube looks strong, Meta looks strong, retail media looks strong, and the TV post-buy says the plan hit its targets. Then finance adds up the actual sales, and the numbers don’t come close.
That gap is what most enterprise marketers are living with right now. Each channel gives a confident account of its own performance, and none of them accounts for the person who saw the same ad on four screens in one week. Cross-media measurement gives you one deduplicated view of what the whole plan did, so budget decisions stop depending on whichever channel reports the loudest.
Consumers interact with brands across multiple devices and platforms. Powered by reliable data and advanced data science, Optivos provides a unified, deduplicated view of audience engagement, helping you plan, optimize, and measure marketing performance with confidence.

Why Channel-level Reporting Breaks Down At Enterprise Scale
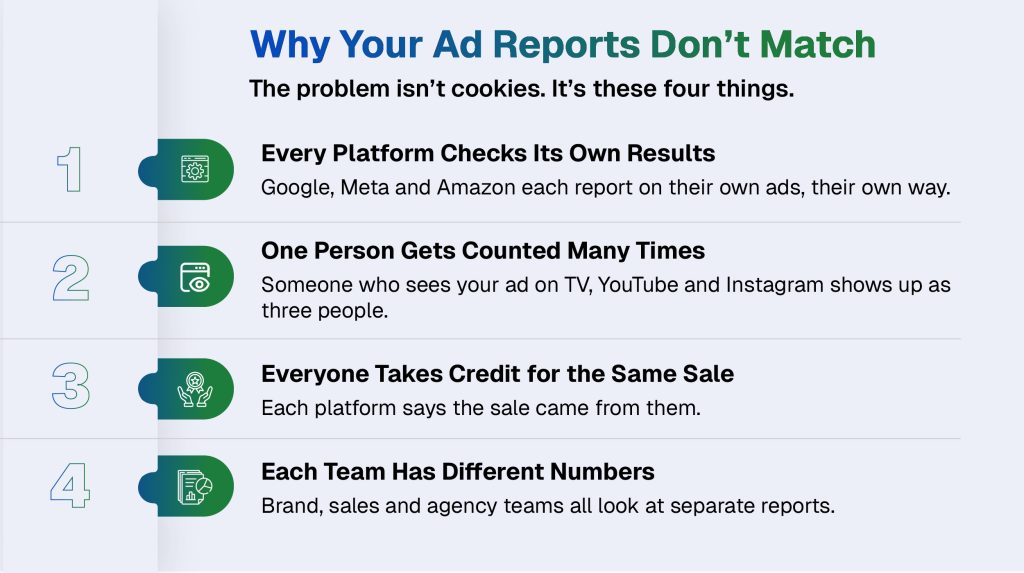
For years the industry blamed third-party cookies for messy attribution. Google has since decided to keep cookies in Chrome, and the gaps haven’t closed, which tells you cookies were never the main cause.
The deeper problems are structural:
- Walled gardens grade their own work. Google, Meta, Amazon and TikTok each measure their own inventory, with their own attribution windows and their own rules.
- Nobody deduplicates. A customer who sees your ad on connected TV, YouTube and Instagram shows up as three separate people in three separate reports.
- Credit gets counted more than once. Every platform claims the conversions it touched, so the total of platform-reported sales usually runs well above what finance actually booked.
- Different teams own different numbers. Brand, performance, retail media and the agencies often report from separate dashboards with separate definitions of success.
And wasted media is only part of the cost. When nobody can say for sure what a channel really did, good ideas get shelved because no one can prove they’d work. Some of those ideas could have grown the business. They just never got a fair shot.
Meanwhile, budgets aren’t getting any bigger. Gartner’s 2026 CMO Spend Survey shows marketing still sitting at 7.8% of company revenue, about where it was last year, and 56% of CMOs say they don’t have the budget to deliver their strategy (Gartner). So if you want growth, you have to find it by shifting money between channels. And every time you do that, your CFO is going to ask for proof.
How To Select The Best Cross-media Measurement Tool
Media measurement platforms promise full-funnel visibility and omnichannel insights. However, many rely on disconnected reports, platform-specific data, or limited attribution models that fail to show how media investments perform across channels.
Marketing teams are left making critical budget decisions without a complete picture of performance.
A robust cross-media measurement solution goes beyond reporting. It helps businesses understand the impact of each channel and make informed decisions about media investments.
Key highlights:
- A cross-media measurement tool consolidates data across media channels, deduplicates audience impressions, and provides a clearer view of campaign performance.
- Effective cross-channel optimization starts with clear business goals, measurement priorities, and an understanding of the insights needed to improve marketing outcomes.
- Look for platforms that support incrementality measurement, continuous model updates, scenario planning, and transparent insights to guide cross-media optimization.
- Avoid tools that simply combine reports from different advertising platforms. Evaluate their measurement methodology, implementation requirements, and ability to translate insights into actionable budget decisions.
Ultimately, the right cross-media measurement solution enables smarter marketing budget optimization by identifying which channels drive incremental results and where your next investment will deliver the greatest impact.
What Is Cross-media Measurement Actually Trying To Answer?
Most measurement fights start when someone asks a tool the wrong question. It’s easier to think of cross-media measurement as three separate questions, each with its own method.
1. Exposure: Who did we reach, and how often?
Cross-media audience measurement estimates how many unique people were reached across the channels covered and how frequently they were exposed. It uses available audience data and modeling to account for overlap between channels, but it cannot perfectly identify every person across every screen. This is separate from marketing mix modeling (MMM), which estimates how channels contribute to business outcomes rather than deduplicating audiences.
2. Contribution: What did each channel actually cause?
Two methods work together here:
- Marketing mix modeling (MMM) estimates how much each channel added to sales, even channels you can’t track person by person, like TV, radio and billboards.
- Incrementality tests, such as geo tests and holdouts, check whether the model is right.
Modeling has also become far more affordable. The better setups feed test results straight back into the model, so it gets sharper over time.
3. Currency: What do we pay on?
This is the audience number buyers and sellers agree to trade on, mostly for TV and video. It sets the price, but it tells you nothing about results.
Where Most Companies Go Wrong
They lean on one of these three and ignore the rest. Performance teams trust platform dashboards. Brand teams buy one MMM a year and treat it as fact.
Neither team knows how often the same person saw the ad across YouTube and TV. So a plan can look healthy in every single report while the overall frequency is way off.
What To Track Beyond Channel Silos
Channel metrics still matter for running each channel day to day. The metrics below are different, because they only exist once you look across channels, and that’s why most enterprise dashboards don’t carry them yet.
- Deduplicated frequency distribution. Average frequency hides the real picture. A campaign averaging five exposures can be hitting a third of its audience twelve times and half of it only once. Track the share of people at one exposure, at your effective frequency, and above the point where extra exposures stop paying off.
- Cost per incremental outcome. This is the cost of each sale, lead or sign-up that wouldn’t have happened without the advertising. It’s harder to produce than ROAS, but it’s the number that survives when finance asks whether you’d have made the sale anyway.
- Marginal return by channel. Average return describes what a channel has delivered so far, while marginal return estimates the return from the next dollar invested. A strong average return does not necessarily mean a channel is close to saturation. Use your mix model’s response curves to estimate how returns may change as spending increases or decreases.
- Platform claim ratio. Add up the conversions every platform claims, then divide by the conversions your own systems recorded. Anything above one is double counting, and a ratio that keeps rising while sales stay flat means more of your reporting is platforms claiming the same customer.
- Experiment coverage. Track the share of total spend that has been validated by a holdout or geo test in the last twelve months. A low number means fewer of your mix model’s estimates have been validated through experiments, leaving more uncertainty around the estimated channel impact.
- Decision speed. Measure the time between spotting a problem, such as a saturated channel, and budget actually moving. In many large organizations it takes a full quarter or more, and by then the insight has expired.
How Do You Combine MMM And Incrementality Testing?
The strongest unified marketing measurement programs treat the mix model and experiments as a single loop. The model runs first and points to the channels where it’s least certain or where the most money is at stake, and those become the next experiments. When a geo test comes back, its result feeds into the model, which tightens the estimate for that channel and often shifts the estimates for others. Over a year or two, the model rests more on evidence and less on assumption.
A few practical rules make the loop work:
- Test the channels you love, as well as the ones you doubt. Branded search and retargeting are the usual suspects for taking credit for demand that already existed.
- Refresh the model at least quarterly, since an annual model can’t guide decisions that get made every month.
- Log every disagreement between a test and the model. Persistent gaps show where the model’s assumptions are off.
- Keep platform-reported numbers for cross-media optimization, and keep them out of cross-channel budget decisions.
Why Every Channel Owner Pushes Back
Once a shared cross-channel view exists, each channel owner tends to argue that it undervalues them. Retail media networks say mix models miss the impact of always-on spend. TV broadcasters say cross-media tools favor digital. Platforms point to their own lift studies. Some of these objections are reasonable, but plenty come from sellers who would naturally prefer to mark their own homework.
The fix is governance, agreed before any results come in. Decide up front:
- Which method settles which question
- What level of evidence is needed to move a channel’s budget, and by how much
- Who has the final say when an experiment and the model disagree
Put it in writing and get finance to sign off. When someone disputes a result six months later, the conversation is about rules they already accepted rather than a model they never trusted.
What Does Cross-media Measurement Cost To Implement?
The software is usually the smallest line item. What matters more is independence: be careful with any measurement supplied by a company that also sells you media, and check what it says about its own channels with tests you control.
The bigger costs sit in four places:
- Clean data. One consistent taxonomy for spend across every agency, platform and market. It’s unglamorous work, and nothing else functions without it.
- People. Analysts who can build and maintain a model and design a proper geo test, plus a measurement lead with the authority to say a channel isn’t working.
- Experiments. A holdout may involve a short-term trade-off if withholding advertising reduces sales in the test group. The purpose is to measure whether the advertising generated incremental results and use that evidence to guide future spending decisions.
- Time. Expect the first credible cross-channel view to take a few quarters, not a few weeks.
Rollouts tend to go wrong for familiar reasons. The dashboard gets built before anyone agrees which decisions it should drive. Every agency supplies its own effectiveness study, and every one of them shows a positive return. And the program tries to measure everything at once instead of proving its value early on a single, expensive question.
Where To Begin With Cross-media Measurement
The programs that last usually begin with a narrow question that carries a lot of money, rather than a grand framework. For most enterprises that means excess frequency on video, or a lower-funnel channel such as branded search that has never faced a holdout. Run the experiment, act on what it shows, and take the freed-up budget to finance. That first result earns the credibility, and often the funding, for everything that follows.
A useful test for any marketing leadership team is to take its biggest channel and ask: if we cut it by 20% next quarter, what would we lose, and how would we know?
If the honest answer comes from that channel’s own dashboard, the organization doesn’t have cross-media measurement yet. It has a set of channel reports that happen to share a slide deck.
Closing Thoughts
More of your media is now bought by the platforms’ own automated tools. They decide where a lot of your money goes, and each one grades its own results.
So who checks the machines?
That’s where cross-media measurement is heading. It’s becoming the independent referee that tells you which platform actually earned your next dollar.
How are you measuring across channels today?
Get de-duped with Optivos! – Book Demo