Email:
inquiry@heliosz.ai
 Phone: +1 (332) 255-6223





 5 Min Read

You’re spending money on Google, Meta, TV and maybe a few other channels. Then your boss asks a simple question: “Which of these is actually driving sales?”
So you check your reports, and that’s where it gets confusing. Your attribution tool says Google is the winner, your media mix model says TV is doing the heavy lifting, and every ad platform claims credit for the same customer.
We are going to break down the three methods behind those reports, MMM vs MTA vs Incrementality in plain English:
- Marketing mix modeling (MMM) studies your total spend and sales over time and tells you how much each channel, online and offline, contributes to revenue. It’s the method you use to decide how to split your budget.
- Multi-touch attribution (MTA) tracks the clicks, emails and ads a customer interacts with before they buy, and gives each one a share of the credit. It’s the method you use to improve your digital campaigns week to week.
- Incrementality testing shows your ads to one group and holds them back from a similar group. The difference in sales between the two groups shows what your marketing truly caused.
None of these methods is wrong. They just answer different questions.
In this blog post on MMM vs MTA vs Incrementality, you’ll learn exactly when to use each one, why they sometimes disagree, and how to combine all three so you can finally trust your numbers and grow faster.
MMM vs MTA vs Incrementality: What Each Method Answers
The easiest way to understand these three methods is to look at the question each one is designed to answer. Once you see them side by side, it becomes clear why they don’t always agree and why you need more than one.
| Metric | Marketing Mix Modeling (MMM) | Multi-Touch Attribution (MTA) | Incrementality Testing |
| Question it answers | How much does each channel contribute to sales, and how should I split my budget? | Which ads, campaigns and touchpoints led to a conversion? | Did this campaign or channel actually cause extra sales? |
| Level of analysis | Big picture: channels and the full marketing mix | Detailed: individual customer journeys, campaigns and creatives | Focused: one channel, campaign or tactic at a time |
| Data needed | Two to three years of weekly spend and sales data, plus factors like pricing, seasonality and promotions | User-level data on clicks, impressions and conversions | A test group that sees the ads and a similar control group that doesn’t |
| Offline coverage | Yes, including TV, radio, print, out-of-home and in-store | No, digital touchpoints only | Yes, using geo tests across regions |
| Causal or not | Not on its own, because it finds patterns in historical data. It becomes more reliable when test results are used to calibrate it | No, it divides up credit but can’t prove cause | Yes, it’s the closest thing to proof in marketing |
| Speed | Slower to build. Results usually refresh weekly, monthly or quarterly | Fast, often near real time | Each test usually takes two to six weeks, plus setup time |
| Best use | Annual and quarterly budget planning, channel mix decisions and forecasting | Daily and weekly optimization of digital bids, ads and audiences | Validating a channel before scaling it, and settling disagreements between MMM and MTA |
| Typical failure | Drifts away from reality when it isn’t checked against real experiments | Gives too much credit to lower-funnel channels like branded search and retargeting, and misses offline impact | Too slow and costly to run for every channel and every decision |
What Is Marketing Mix Modeling (MMM)?
Marketing mix modeling (MMM) is a statistical method that shows how much each marketing channel contributes to your sales.
Instead of tracking individual customers, MMM looks at your total spend and sales over the past two to three years. It also accounts for other factors that affect sales, like seasonality, pricing and promotions. That way, it can separate what marketing drove from what would have happened anyway.
MMM also shows when a channel stops paying off, so you know where your next dollar will work hardest. Because it doesn’t rely on cookies or user tracking, it’s privacy-safe, which is why 46.9% of US marketers plan to invest more in it.
Pros and Cons of MMM
Pros
- Measures every channel, including TV, print and other offline media
- Privacy-safe, with no need for cookies or user tracking
- Separates marketing impact from pricing, seasonality and promotions
- Ideal for budget planning and forecasting
Cons
- Needs two to three years of clean historical data
- Can’t show which specific ad or creative performed best
- Too slow for day-to-day campaign changes
- Can drift from reality unless it’s checked with incrementality tests
READ MORE: Adaptive MMM for Advertisers
What Is Multi-Touch Attribution (MTA)?
Multi-touch attribution (MTA) is a method that gives credit for a sale to each digital touchpoint a customer interacted with before buying.
Say someone sees your Instagram ad, clicks a Google search ad a few days later, and then buys after opening your email. Last-click reporting would give all the credit to the email. MTA shares the credit between all three, so you can see how each step helped.
Because it works at the level of individual campaigns, ads and keywords, MTA is useful for quick, day-to-day decisions like adjusting bids, pausing weak ads or refining audiences.
MTA Model Types
- Linear: Gives equal credit to every touchpoint.
- Time decay: Gives more credit to touchpoints closer to the purchase.
- Position-based (U-shaped): Gives most of the credit to the first and last touchpoints, and splits the rest across the middle.
- W-shaped: Gives extra credit to the first touch, a key middle step like a sign-up, and the final touch.
- Data-driven: Uses machine learning to assign credit based on how real customer journeys convert.
Pros and Cons of MTA
Pros
- Gives fast, detailed insight into campaigns, ads and keywords
- Helps optimize digital spend day to day
- More balanced than last-click reporting
- Easy to access through ad platforms and MTA attribution tools
Cons
- Can’t measure TV, radio, print or in-store activity
- Losing accuracy as cookies, privacy rules and walled gardens limit tracking
- Assigns credit, but can’t prove an ad actually caused the sale
- Tends to over-credit lower-funnel channels like branded search and retargeting
What Is Incrementality in Marketing?
Incrementality in marketing refers to the additional sales that happened only because of a specific campaign or channel. Put simply, it’s the revenue you would have lost if you hadn’t run that marketing at all.
This is what separates incrementality from attribution. Attribution shares out credit for every sale that happened, including sales from customers who were going to buy anyway. Incrementality strips those out and shows only the sales your marketing actually caused, which is why 52% of US brand and agency marketers now use incrementality testing and experiments.
How Incrementality Testing Works
Incrementality testing works much like a scientific experiment. You split your audience or your markets into two similar groups, show your ads to one group (the test group) and hold them back from the other (the control group). Since the marketing is the only real difference between the two groups, any extra sales in the test group can be credited to that campaign.
There are a few common ways to set this up. Geo tests run ads in some regions while pausing them in similar regions. Audience holdouts keep ads away from a random portion of your target audience. Platforms like Google and Meta also offer built-in lift studies that run these experiments for you inside their own ecosystems.
How to Calculate Incrementality
Once your test is finished, two simple formulas tell you whether the campaign worked and whether it was worth the money.
- Incremental lift = (Test result − Control result) ÷ Control result
- Incremental ROAS (iROAS) = Incremental revenue ÷ Ad spend
Incremental lift shows how much your marketing increased results, while iROAS shows how much extra revenue each dollar of ad spend generated.
Worked example: Imagine a retailer runs a four-week geo test on social media ads, using test and control regions with similar size and sales history. The test regions bring in $575,000 in revenue, the control regions bring in $500,000, and the campaign costs $50,000.
That gives the retailer $75,000 in incremental revenue ($575,000 − $500,000) and an incremental lift of 15% ($75,000 ÷ $500,000). Dividing the incremental revenue by the $50,000 spend gives an iROAS of 1.5, meaning every dollar spent generated $1.50 in revenue that wouldn’t have happened otherwise. If the ad platform had reported a ROAS of 4.0 for the same campaign, the retailer would now know that most of that credited revenue was coming in regardless.
How to Analyze Incremental Lift from TV Campaigns
TV is difficult to measure with attribution because there’s no click to follow, so the most reliable approach is a matched-market test.
Start by choosing regions with similar sales history, population and seasonality, and track sales across all of them for a few weeks before the campaign begins to set a baseline. Then run your TV campaign in the test markets only, keeping the control markets dark or at much lower spend.
When you measure results, look beyond online conversions. TV influences total sales, branded search, direct website visits and in-store purchases, and its impact often continues for several weeks after the ads stop airing, so keep measuring after the campaign ends. Finally, compare the lift between test and control markets and feed that result into your MMM, so the model’s view of TV is based on real evidence.
Pros and Cons of Incrementality Testing
Pros
- It proves what your marketing actually caused, rather than just assigning credit.
- It works for both online and offline channels, including TV.
- It reveals when platform-reported results are inflated.
- It settles disagreements when MMM and MTA point in different directions.
- It makes your MMM more accurate when the results are used to calibrate the model.
Cons
- Each test takes several weeks and answers only one question at a time.
- Holding back ads from the control group means giving up some sales during the test.
- Smaller channels may not generate enough volume to produce a reliable result.
- It can’t run continuously across every channel, so it works best alongside MMM and MTA.
When MMM and MTA and Incrementality Give Different Answers
It’s very common for these methods to show different results. That doesn’t mean one of them is wrong. Each one simply sees a different part of what’s happening. These are the three situations you’re most likely to run into.
Scenario 1: TV shows zero ROI in attribution, but positive results in MMM
People don’t click on TV ads. They see the ad, and later they search for your brand on Google or visit your website. Attribution only sees that search or website visit, so it gives Google all the credit and shows TV as having zero return.
MMM looks at your total sales instead. It notices that sales went up whenever you ran TV, so it gives TV the credit it deserves. In this case, MMM is giving you the more accurate picture.
Scenario 2: Ad platforms show a higher ROAS than MMM (double counting)
Imagine a customer sees your ad on Meta, then clicks your Google ad, and then buys. Meta counts that sale as its own, and so does Google. One sale gets counted twice.
When every platform does this, their combined results add up to more sales than you actually made. MMM uses your real total sales, so each sale is only counted once. That’s why MMM usually shows a lower but more honest ROAS.
Scenario 3: Attribution says spend more on a channel, but sales don’t grow (saturation)
Your attribution report shows a channel is performing really well, so you double its budget. But your total sales barely change.
This happens because every channel has a limit. Once you’ve reached most of the people who are likely to buy, spending more doesn’t bring in many new customers. Attribution can’t see that limit, but MMM can. It shows you the point where extra spending stops paying off.
Incrementality testing as the tiebreaker
When two methods disagree, an incrementality test gives you the final answer. You simply run the campaign for one group and not for another, then compare the sales.
For example, if you’re not sure whether TV is working, run it in some cities and not in others. If sales go up in the cities with TV, you have clear proof.
You can then use that result to improve your MMM, so your future decisions are based on real evidence instead of guesswork.
Which Method to Use, When
The easiest way to choose is to start with the decision you need to make. Each method is built for a different type of decision, so match the method to the question you’re trying to answer.
Use MMM when you’re planning your budget. If you’re deciding how much to spend on TV versus digital, or how to split next year’s budget across channels, MMM is the right tool. It’s also the best choice when you run offline media or want to forecast what a budget change will do to sales.
Use MTA when you’re optimizing digital campaigns. If you need to decide which ads to pause, which keywords to bid on or which audiences to focus on this week, MTA gives you the quick, detailed view you need. It works best for day-to-day changes inside digital channels.
Use incrementality testing when you need proof. If you’re about to scale a channel, launch a new one, or your MMM and MTA are telling you different things, run a test first. It tells you whether the channel is really driving sales before you put more money behind it.
| If you want to know… | Use this method |
| How to split budget across all channels | MMM |
| Whether TV or other offline media is working | MMM, confirmed with a geo test |
| Which ads, keywords or audiences perform best | MTA |
| Whether a channel is actually driving new sales | Incrementality testing |
| What will happen if you increase or cut spend | MMM |
| Which number to trust when reports disagree | Incrementality testing |
What you need depends on your marketing mix?
You don’t need all three methods on day one. Brands that spend mostly on digital channels can start with MTA and run a few incrementality tests on their biggest channels. As you add channels like TV, retail media or out-of-home, MMM becomes essential, because it’s the only method that measures everything together.
For enterprise brands, the real challenge isn’t choosing a method but keeping all the numbers connected. That’s where a platform like Optivos helps, by bringing your marketing data into one place, measuring the ROI of every channel from TV to TikTok, and letting you test budget scenarios before you commit the spend.
Challenges of Combining MTA, MMM and Incrementality Measurement
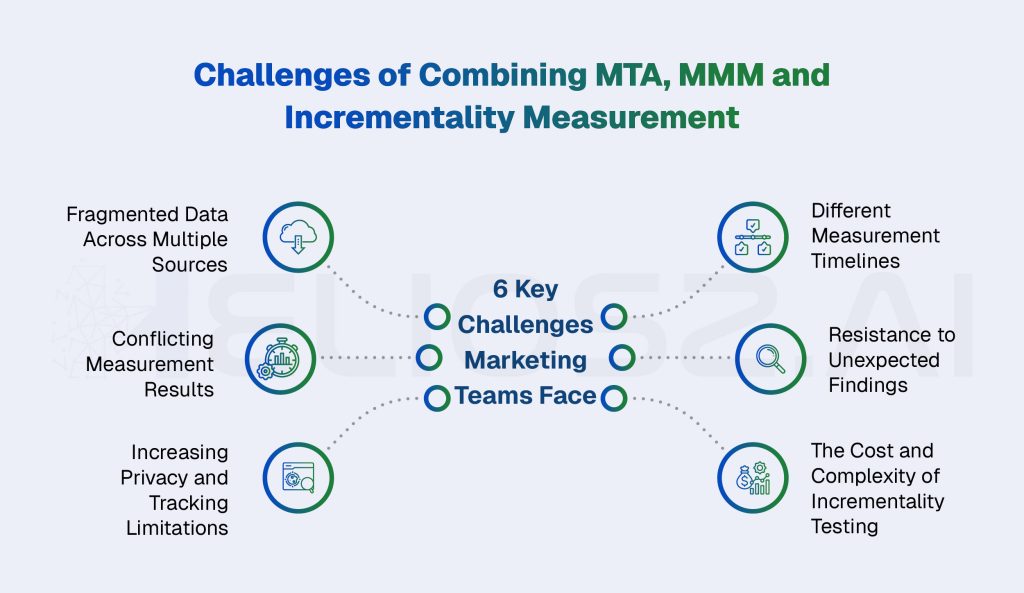
Using all three methods together gives you the most accurate picture of your marketing. But getting them to work as one system isn’t easy. These are the challenges most teams run into:
- Data sits in different places. Spend data lives in ad platforms, sales data sits in your CRM or ERP, and offline media data often comes in spreadsheets from agencies. When each method pulls from a different source, the results won’t match.
- Each method works on a different timeline. MTA updates daily, incrementality tests take several weeks, and MMM is usually refreshed monthly or quarterly. Lining up results across such different timelines is hard, especially when you need to make a decision quickly.
- Nobody agrees on which number to trust. Without clear rules on which method guides which decision, teams end up arguing over whose report is right. The performance team trusts attribution, the brand team trusts MMM, and decisions get stuck.
- Results can go against old beliefs. The first incrementality tests often show that a favourite channel isn’t driving as much as everyone thought. That can be hard for teams to accept, even when the evidence is clear.
- Tracking keeps getting harder. Privacy rules, cookie loss and walled gardens like Meta and Google limit how much user-level data MTA can see, which makes its results less complete over time.
- Testing has real costs. Every incrementality test means holding back ads from some customers, and you can’t run tests on every channel at once. Teams have to choose carefully where testing matters most.
- It needs specialist skills. Building reliable models and designing proper experiments requires data science expertise that many marketing teams don’t have in-house.
Most of these problems start with disconnected data and channel silos. Our guide on measuring beyond channel silos explains how enterprise teams can fix that foundation first.
How to Build a Unified Marketing Measurement Stack
A unified marketing measurement stack connects MMM, MTA and incrementality testing so they work as one system instead of three separate reports. The goal is simple: everyone in the business looks at the same numbers and knows which method to trust for which decision.
You don’t need to build it all at once. Most teams get there step by step:
1. Get your data in one place
Everything starts with your data. Bring your media spend, sales, campaign and offline data into a single source, and use the same names and definitions across every channel. If “paid social” means one thing in your ad reports and something else in your sales data, no model will give you reliable answers.
2. Use incrementality tests to calibrate your MMM
Your MMM finds patterns in past data, but it can’t prove cause on its own. That’s where incrementality tests come in. When a geo test shows the real impact of a channel, feed that result into your model. Modern MMMs are designed to take in test results this way, so each test makes the model more accurate.
3. Use MMM to keep MTA honest
Attribution often gives too much credit to digital channels, especially lower-funnel ones. A practical approach is to use MMM estimates as a reference point when evaluating attribution results. If MMM estimates that paid search contributed a certain share of sales, attribution can help break that contribution down across campaigns and keywords. Comparing the two helps identify potential over-crediting and keeps campaign-level estimates grounded in the broader picture.
4. Decide which method owns which decision
Agree on clear rules so teams stop arguing over whose number is right. MMM guides budget planning across channels, MTA guides day-to-day digital optimization, and incrementality tests settle any disagreement between the two.
5. Plan your tests carefully
You can’t test everything, so focus on where the money and uncertainty are highest. Start with your biggest channels, the ones you’re thinking of scaling, and the ones where your methods disagree the most.
6. Connect measurement to forecasting
Measurement shouldn’t stop at explaining last quarter. Once your models are reliable, use them to plan ahead, by connecting marketing spend to revenue and forecasting what different budget choices will deliver. This is where predictive analytics in marketing helps teams move from reporting results to shaping them.
Put together, these steps turn three competing reports into one trusted view of what’s working, so every budget decision is backed by evidence rather than guesswork.
How Optivos Brings MMM, MTA and Incrementality Together
Most marketing teams already have the data they need. The problem is that it’s scattered across ad platforms, sales systems, agency reports and spreadsheets, so every method tells a different story and nobody knows which one to trust.
Optivos, the commercial intelligence platform from Heliosz.ai, solves this by giving your marketing, sales and finance teams one connected view of performance. Instead of switching between separate reports, you get a single source of truth for every marketing decision.
With Optivos, you can:
- Bring all your data together. Connect media spend, sales, campaign and offline data into one governed foundation, so every number comes from the same source.
- Measure the true ROI of every channel. See how each marketing lever contributes to revenue, from TV to TikTok, using unified models.
- Plan budgets with confidence. Run “what-if” scenarios to see how shifting spend between channels will affect results, before you commit a single dollar.
- Separate real growth from noise. Understand which gains are truly incremental and which would have happened anyway.
- Get answers in plain English. Ask questions about ROI, trade-offs or forecasts and get instant answers, without needing SQL or a data team.
- Keep full control of your data. Your data stays yours, with the option to deploy Optivos in your own cloud environment.
The result is measurement that doesn’t just explain last quarter’s results but helps you decide where to invest next.
See what your marketing is really driving
Stop guessing which report to believe. Discover how Optivos connects your measurement into one clear view of growth.
Closing Thoughts
If you’ve been trying to pick between MMM, MTA and incrementality testing, the good news is that you don’t have to.
Each method answers a different question. MMM shows you where to invest across all your channels, MTA helps you improve your digital campaigns day to day, and incrementality testing proves what’s actually driving sales. When you use them alone, each one leaves gaps. When you connect them, those gaps start to disappear.
The brands that grow fastest don’t get stuck arguing over which report is right. They let experiments sharpen their models, use those models to keep attribution realistic, and make every budget decision based on evidence instead of guesswork.
If you’re ready to bring all of your measurement into one clear view, see how Optivos can help.
So which method is your team relying on most right now, and where do your numbers disagree the most?
FAQs
1. What is the difference between MMM and MTA?
MMM looks at your total spend and sales over time to show how much each channel, including TV and other offline media, contributes to revenue. MTA tracks the digital touchpoints a customer interacts with before buying and shares the credit between them.
2. Is incrementality the same as attribution?
No. Attribution gives credit to the touchpoints involved in a sale, even if the customer would have bought anyway. Incrementality measures only the sales that happened because of your marketing, by comparing people who saw your ads with people who didn’t.
3. Can you use MMM and MTA together?
Yes, and most mature marketing teams do. MMM helps estimate how much budget each channel should get, and MTA helps you optimize spending within digital channels. Teams can also compare MTA results with MMM estimates to identify potential over-crediting by digital channels and keep attribution results aligned with the broader marketing picture.
4. Does incrementality testing replace MMM?
No. Incrementality tests answer one question at a time and take several weeks to run, so you can’t test every channel all the time. MMM covers your full marketing mix continuously. The two work best together, with test results used to calibrate your MMM so it becomes more accurate over time.
5. Which is better for measuring TV and offline channels, MMM or MTA?
MMM is the better choice. MTA depends on clicks and digital tracking, so it can’t see the impact of TV, radio, print or out-of-home ads. MMM measures how total sales change when you increase or reduce offline spend. For the strongest proof, confirm your MMM results with a geo-based incrementality test.